
Postcode: 2081, NSW - Sale Price Report
Posted on November 15, 2023 • 4 minutes • 758 words
Property analysis sections
Welcome
Welcome to the Property Panther 2081 postcode sale price report! We value your feedback. Please take a moment to complete our survey and help us improve our property analysis.
Who is this useful for?
Home Buyers:
Understand property affordability in your preferred suburb. Get a detailed breakdown of property types and prices, market dynamics including time on market and transaction volume.
Investors:
Use our report to determine the right time to invest. Gain a comprehensive view of property demand, transaction volume, and current market situation to guide your strategies.
Sellers:
Get insights on potential selling time based on market trends. Understand market pace from ‘Time On Market’ and ‘Transaction Volume’, and learn to price your property competitively from ‘Property Price’.
Location Overview
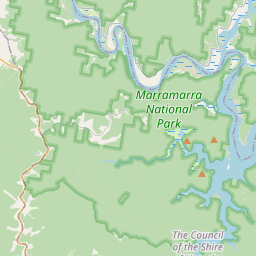
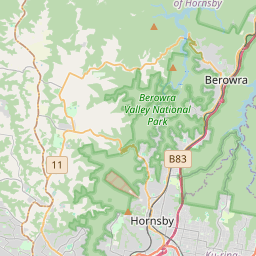
Welcome to the charming postcode 2081 in NSW, home to the suburbs of Berowra and Cowan. This idyllic area boasts a diverse housing stock, ranging from charming cottages to modern family homes, with a lifestyle that embraces tranquil bushland surroundings, outdoor recreational opportunities, and a close-knit community.


Last Month Property Summary
In 2081 in NSW, the real estate market transitioned from a buyers market to a sellers market with an increase in new sale listings, a significant decrease in median days on market, and a higher median sold price.
Property Type Breakdown
In the picturesque postcode 2081 of NSW Australia, house hunters will be pleased to find a diverse property market, with houses taking the lead with 62% of listings, closely followed by semi-detached properties and a sprinkle of vacant and new land options.
Property Demand - Time On Market
Looking at the number of days it takes to sell a property is a good indicator of the amount of demand in a market because it shows how quickly properties are being purchased, reflecting interest and competition among buyers.
Time On Market - Overall
The average monthly change in the Days on Market for properties in postcode 2081 during the period shown below was -2 days.
This chart shows the trend of Days on Market over time. Each point on the line represents the average number of days a property was on the market before being sold in a particular month.
Time On Market - By Property Type
Time On Market - By Suburb
NA – NA
NA – NA
NA – NA
NA – NA
NA – NA
NA – NA
NA – NA
NA – NA
NA – NA
No data
Property Transaction Volume
Transaction Volume - Overall
Transaction Volume - By Property Type
Transaction Volume - By Suburb
0 – 0
0 – 0
0 – 0
0 – 0
0 – 0
0 – 0
0 – 0
0 – 0
0 – 0
Property Price
Price - Overall
The average monthly change in the median sold price of properties in postcode 2081 during the period shown below was $-16857. The trend shows a decrease in the median sold price over time.
Price - By Property Type
Price - By Suburb
$NA – NA
$NA – NA
$NA – NA
$NA – NA
$NA – NA
$NA – NA
$NA – NA
$NA – NA
$NA – NA
No data
Thanks for reading our property analysis! We value your feedback. Please take a moment to complete our survey.