Postcode: 2083, NSW - Sale Price Report
Posted on November 15, 2023 • 5 minutes • 945 words
Property analysis sections
Welcome
Welcome to the Property Panther 2083 postcode sale price report! We value your feedback. Please take a moment to complete our survey and help us improve our property analysis.
Who is this useful for?
Home Buyers:
Understand property affordability in your preferred suburb. Get a detailed breakdown of property types and prices, market dynamics including time on market and transaction volume.
Investors:
Use our report to determine the right time to invest. Gain a comprehensive view of property demand, transaction volume, and current market situation to guide your strategies.
Sellers:
Get insights on potential selling time based on market trends. Understand market pace from ‘Time On Market’ and ‘Transaction Volume’, and learn to price your property competitively from ‘Property Price’.
Location Overview
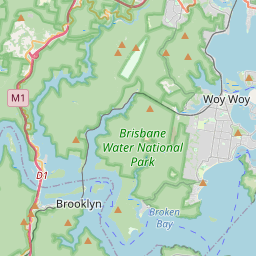
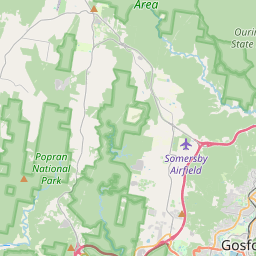
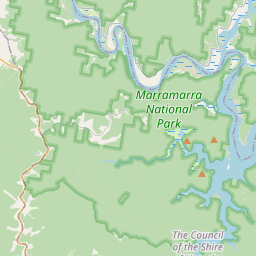
Welcome to postcode 2083 in NSW, a picturesque region situated along the Hawkesbury River. This area offers a serene waterfront lifestyle with charming suburbs like Cogra Bay, Bar Point, and Dangar Island, providing a range of housing options including riverside cottages, tranquil retreats, and modern waterfront homes, ideal for those seeking a peaceful escape from the city.

Last Month Property Summary
In August 2083, the number of new listings and median sold prices increased, while the median days on market also increased, suggesting a shift towards a slower market favoring buyers in NSW.
Property Type Breakdown
Welcome to the captivating postcode of 2083 in NSW Australia, where house listings reign supreme, occupying a delightful 100% of the property stock!
Property Demand - Time On Market
Looking at the number of days it takes to sell a property is a good indicator of the amount of demand in a market because it shows how quickly properties are being purchased, reflecting interest and competition among buyers.
Time On Market - Overall
This chart shows how many properties were sold in postcode 2083 during the month of September. Each bar in the chart represents a range of days that properties were up for sale before they were sold. Properties that were on the market for more than 200 days are not included.
The average monthly change in the Days on Market for properties in postcode 2083 during the period shown below was 7 days.
This chart shows the trend of Days on Market over time. Each point on the line represents the average number of days a property was on the market before being sold in a particular month.
Time On Market - By Property Type
Time On Market - By Suburb
64 – 64
64 – 64
64 – 64
64 – 64
64 – 64
64 – 64
64 – 64
64 – 64
64 – 64
No data
Property Transaction Volume
Transaction Volume - Overall
Transaction Volume - By Property Type
Transaction Volume - By Suburb
0 – 0
0 – 0
0 – 0
0 – 0
0 – 0
0 – 0
0 – 1
1 – 1
1 – 1
Property Price
Price - Overall
This chart shows the distribution of property sale prices in postcode 2083 during the month of September. Each bar in the chart represents a range of prices for properties sold.
The average monthly change in the median sold price of properties in postcode 2083 during the period shown below was $27717. The trend shows an increase in the median sold price over time.
Price - By Property Type
Price - By Suburb
$1,050,000 – 1,050,000
$1,050,000 – 1,050,000
$1,050,000 – 1,050,000
$1,050,000 – 1,050,000
$1,050,000 – 1,050,000
$1,050,000 – 1,050,000
$1,050,000 – 1,050,000
$1,050,000 – 1,050,000
$1,050,000 – 1,050,000
No data
Thanks for reading our property analysis! We value your feedback. Please take a moment to complete our survey.