Postcode: 2210, NSW - Sale Price Report
Posted on November 15, 2023 • 4 minutes • 794 words
Property analysis sections
Welcome
Welcome to the Property Panther 2210 postcode sale price report! We value your feedback. Please take a moment to complete our survey and help us improve our property analysis.
Who is this useful for?
Home Buyers:
Understand property affordability in your preferred suburb. Get a detailed breakdown of property types and prices, market dynamics including time on market and transaction volume.
Investors:
Use our report to determine the right time to invest. Gain a comprehensive view of property demand, transaction volume, and current market situation to guide your strategies.
Sellers:
Get insights on potential selling time based on market trends. Understand market pace from ‘Time On Market’ and ‘Transaction Volume’, and learn to price your property competitively from ‘Property Price’.
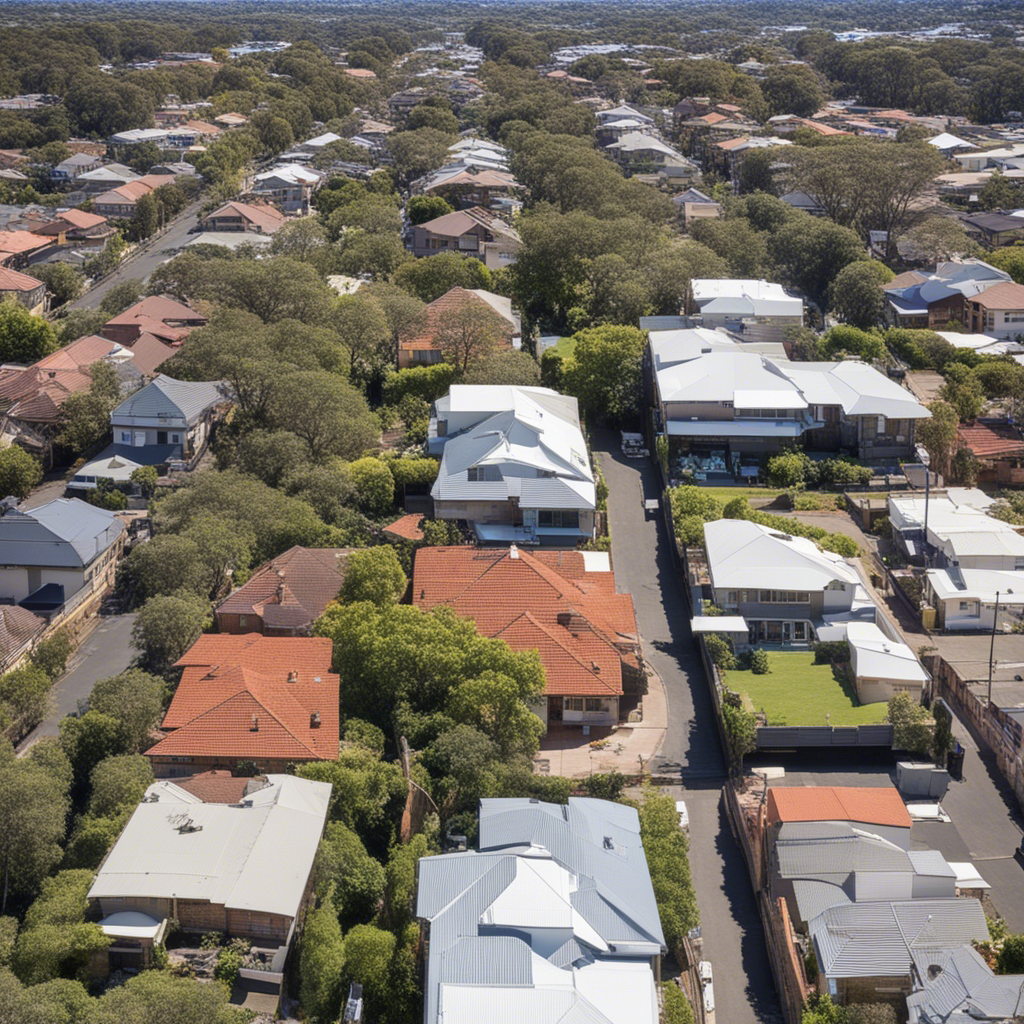
Location Overview
The postcode 2210 in NSW encompasses the suburbs of Peakhurst, Riverwood, Lugarno, and Peakhurst Heights. This vibrant area boasts a diverse housing stock, ranging from charming family homes to modern apartments, all within close proximity to parks, schools, and a bustling selection of shops and cafes to suit any lifestyle.


Last Month Property Summary
In 2210 in NSW, the market has become more favorable for sellers as the median days on market decreased from 31.5 to 20.5, the new sold listings doubled from 20 to 39, and the median sold price increased from 1,100,000 to 1,420,000.
Property Type Breakdown
In the vibrant postcode 2210 of NSW Australia, the property stock offers a diverse range of options, with houses and apartments dominating the market, giving buyers plenty of choices to suit their preferences and lifestyles.
Property Demand - Time On Market
Looking at the number of days it takes to sell a property is a good indicator of the amount of demand in a market because it shows how quickly properties are being purchased, reflecting interest and competition among buyers.
Time On Market - Overall
The average monthly change in the Days on Market for properties in postcode 2210 during the period shown below was 0 days.
This chart shows the trend of Days on Market over time. Each point on the line represents the average number of days a property was on the market before being sold in a particular month.
Time On Market - By Property Type
Time On Market - By Suburb
NA – NA
NA – NA
NA – NA
NA – NA
NA – NA
NA – NA
NA – NA
NA – NA
NA – NA
No data
Property Transaction Volume
Transaction Volume - Overall
Transaction Volume - By Property Type
Transaction Volume - By Suburb
0 – 1
1 – 1
1 – 2
2 – 2
2 – 3
3 – 4
4 – 4
4 – 4
4 – 4
Property Price
Price - Overall
The average monthly change in the median sold price of properties in postcode 2210 during the period shown below was $-2609. The trend shows a decrease in the median sold price over time.
Price - By Property Type
Price - By Suburb
$1,013,000 – 1,126,000
$1,126,000 – 1,239,000
$1,239,000 – 1,352,000
$1,352,000 – 1,465,000
$1,465,000 – 1,486,000
$1,486,000 – 1,507,000
$1,507,000 – 1,528,000
$1,528,000 – 1,549,000
$1,549,000 – 1,570,000
No data
Thanks for reading our property analysis! We value your feedback. Please take a moment to complete our survey.