
Postcode: 2335, NSW - Sale Price Report
Posted on November 15, 2023 • 5 minutes • 927 words
Property analysis sections
Welcome
Welcome to the Property Panther 2335 postcode sale price report! We value your feedback. Please take a moment to complete our survey and help us improve our property analysis.
Who is this useful for?
Home Buyers:
Understand property affordability in your preferred suburb. Get a detailed breakdown of property types and prices, market dynamics including time on market and transaction volume.
Investors:
Use our report to determine the right time to invest. Gain a comprehensive view of property demand, transaction volume, and current market situation to guide your strategies.
Sellers:
Get insights on potential selling time based on market trends. Understand market pace from ‘Time On Market’ and ‘Transaction Volume’, and learn to price your property competitively from ‘Property Price’.
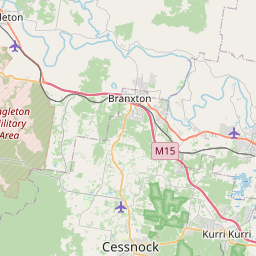
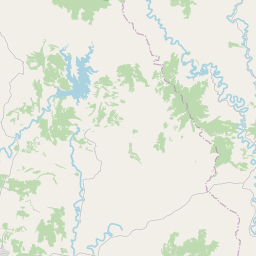
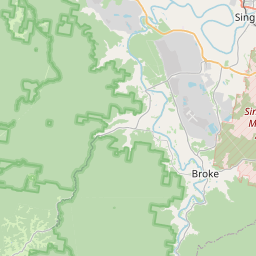
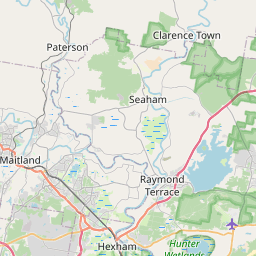
Location Overview
Welcome to the vibrant postcode 2335 in NSW! This sought-after area offers diverse suburbs such as Lower Belford, Elderslie, Branxton, and more, with a variety of housing options to suit every buyer’s needs. With its picturesque landscapes, charming community, and a range of amenities nearby, 2335 provides an idyllic lifestyle for potential homebuyers.
Last Month Property Summary
In 2335, NSW, there is a shift towards a seller’s market as the median days on market decreased from 53.0 to 26.5 and the new sold listings increased from 5 to 17, although the median sold price slightly decreased from 730000 to 670000.
Property Type Breakdown
In postcode 2335, NSW Australia, the property market is brimming with diverse options, ranging from new house and land packages to charming residential houses and even vacant land for those with grand design aspirations.
Property Demand - Time On Market
Looking at the number of days it takes to sell a property is a good indicator of the amount of demand in a market because it shows how quickly properties are being purchased, reflecting interest and competition among buyers.
Time On Market - Overall
The average monthly change in the Days on Market for properties in postcode 2335 during the period shown below was 0 days.
This chart shows the trend of Days on Market over time. Each point on the line represents the average number of days a property was on the market before being sold in a particular month.
Time On Market - By Property Type
Time On Market - By Suburb
NA – NA
NA – NA
NA – NA
NA – NA
NA – NA
NA – NA
NA – NA
NA – NA
NA – NA
No data
Property Transaction Volume
Transaction Volume - Overall
Transaction Volume - By Property Type
Transaction Volume - By Suburb
0 – 0
0 – 0
0 – 0
0 – 0
0 – 0
0 – 0
0 – 0
0 – 0
0 – 1
Property Price
Price - Overall
The average monthly change in the median sold price of properties in postcode 2335 during the period shown below was $-8587. The trend shows a decrease in the median sold price over time.
Price - By Property Type
Price - By Suburb
$NA – NA
$NA – NA
$NA – NA
$NA – NA
$NA – NA
$NA – NA
$NA – NA
$NA – NA
$NA – NA
No data
Thanks for reading our property analysis! We value your feedback. Please take a moment to complete our survey.