
Postcode: 2357, NSW - Sale Price Report
Posted on November 15, 2023 • 5 minutes • 884 words
Property analysis sections
Welcome
Welcome to the Property Panther 2357 postcode sale price report! We value your feedback. Please take a moment to complete our survey and help us improve our property analysis.
Who is this useful for?
Home Buyers:
Understand property affordability in your preferred suburb. Get a detailed breakdown of property types and prices, market dynamics including time on market and transaction volume.
Investors:
Use our report to determine the right time to invest. Gain a comprehensive view of property demand, transaction volume, and current market situation to guide your strategies.
Sellers:
Get insights on potential selling time based on market trends. Understand market pace from ‘Time On Market’ and ‘Transaction Volume’, and learn to price your property competitively from ‘Property Price’.
Location Overview
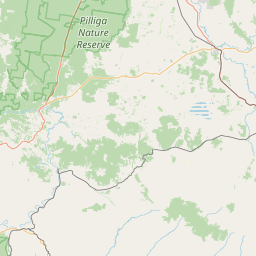
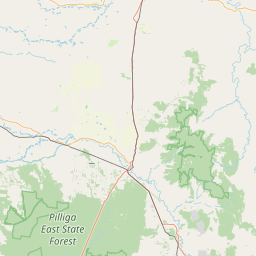
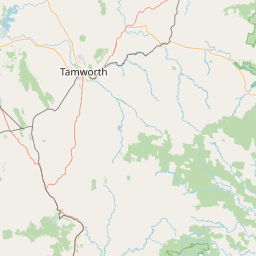
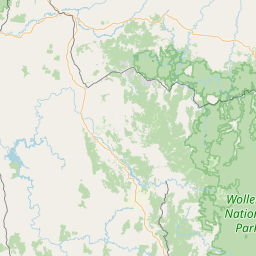
Welcome to the vibrant postcode 2357 in NSW, where diverse suburbs such as Purlewaugh, Coonabarabran, and Ulamambri offer a range of housing options to suit different preferences and lifestyles. From spacious rural properties nestled amongst picturesque landscapes to cozy suburban homes, this area caters to the needs of every property buyer, promising a delightful mix of rural charm and convenient amenities.

Last Month Property Summary
In 2357, NSW, it is more of a sellers market as there is a decrease in median days on market, new sold listings, and a significant increase in median sold price between July and August.
Property Type Breakdown
Welcome to postcode 2357, a vibrant area in NSW Australia where you’ll find a diverse range of properties to suit every lifestyle, from charming houses and sprawling rural estates, to spacious acreage and inviting vacant land waiting to be transformed into your dream home.
Property Demand - Time On Market
Looking at the number of days it takes to sell a property is a good indicator of the amount of demand in a market because it shows how quickly properties are being purchased, reflecting interest and competition among buyers.
Time On Market - Overall
The average monthly change in the Days on Market for properties in postcode 2357 during the period shown below was -8 days.
This chart shows the trend of Days on Market over time. Each point on the line represents the average number of days a property was on the market before being sold in a particular month.
Time On Market - By Property Type
Time On Market - By Suburb
NA – NA
NA – NA
NA – NA
NA – NA
NA – NA
NA – NA
NA – NA
NA – NA
NA – NA
No data
Property Transaction Volume
Transaction Volume - Overall
Transaction Volume - By Property Type
Transaction Volume - By Suburb
0 – 0
0 – 0
0 – 0
0 – 0
0 – 0
0 – 0
0 – 0
0 – 0
0 – 0
Property Price
Price - Overall
The average monthly change in the median sold price of properties in postcode 2357 during the period shown below was $-8587. The trend shows a decrease in the median sold price over time.
Price - By Property Type
Price - By Suburb
$NA – NA
$NA – NA
$NA – NA
$NA – NA
$NA – NA
$NA – NA
$NA – NA
$NA – NA
$NA – NA
No data
Thanks for reading our property analysis! We value your feedback. Please take a moment to complete our survey.