Postcode: 2371, NSW - Sale Price Report
Posted on November 15, 2023 • 4 minutes • 776 words
Property analysis sections
Welcome
Welcome to the Property Panther 2371 postcode sale price report! We value your feedback. Please take a moment to complete our survey and help us improve our property analysis.
Who is this useful for?
Home Buyers:
Understand property affordability in your preferred suburb. Get a detailed breakdown of property types and prices, market dynamics including time on market and transaction volume.
Investors:
Use our report to determine the right time to invest. Gain a comprehensive view of property demand, transaction volume, and current market situation to guide your strategies.
Sellers:
Get insights on potential selling time based on market trends. Understand market pace from ‘Time On Market’ and ‘Transaction Volume’, and learn to price your property competitively from ‘Property Price’.
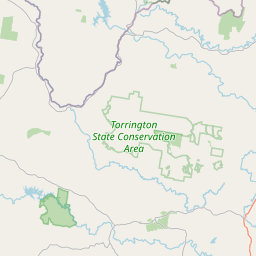
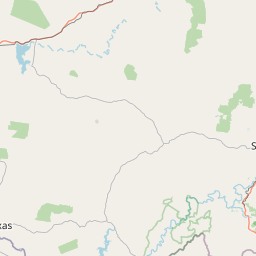
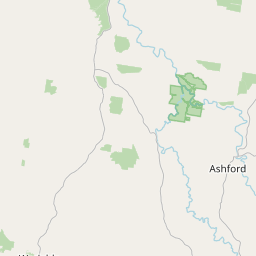
Location Overview
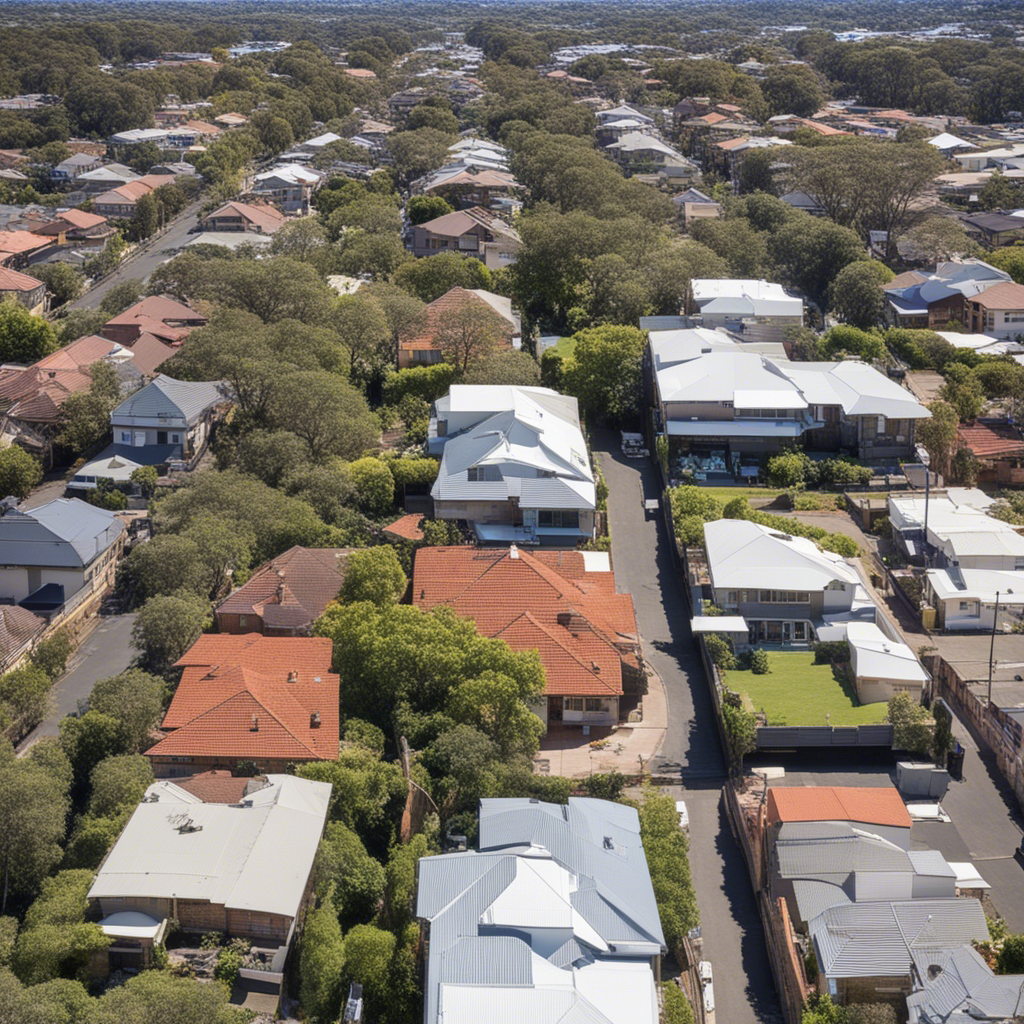
Welcome to the majestic postcode 2371 in NSW, home to charming suburbs like Deepwater, Rocky Creek, and Emmaville. This idyllic area boasts a diverse housing stock ranging from quaint country cottages to sprawling rural estates, while offering a peaceful lifestyle surrounded by picturesque landscapes, perfect for those seeking a tranquil retreat.

Last Month Property Summary
Based on the given numbers, it appears that the housing market in 2371, NSW has shifted from a seller’s market in July to a buyer’s market in August due to the increased median days on market and decreased median sold price.
Property Type Breakdown
Welcome to the property stock overview for postcode 2371 in NSW, Australia, where the offerings include a diverse range of properties, from charming houses and sprawling rural estates to vacant land waiting for your dream home to be built, ensuring there’s something for every aspiring homeowner and investor.
Property Demand - Time On Market
Looking at the number of days it takes to sell a property is a good indicator of the amount of demand in a market because it shows how quickly properties are being purchased, reflecting interest and competition among buyers.
Time On Market - Overall
The average monthly change in the Days on Market for properties in postcode 2371 during the period shown below was -10 days.
This chart shows the trend of Days on Market over time. Each point on the line represents the average number of days a property was on the market before being sold in a particular month.
Time On Market - By Property Type
Time On Market - By Suburb
NA – NA
NA – NA
NA – NA
NA – NA
NA – NA
NA – NA
NA – NA
NA – NA
NA – NA
No data
Property Transaction Volume
Transaction Volume - Overall
Transaction Volume - By Property Type
Transaction Volume - By Suburb
0 – 0
0 – 0
0 – 0
0 – 0
0 – 0
0 – 0
0 – 0
0 – 0
0 – 0
Property Price
Price - Overall
The average monthly change in the median sold price of properties in postcode 2371 during the period shown below was $-9464. The trend shows a decrease in the median sold price over time.
Price - By Property Type
Price - By Suburb
$NA – NA
$NA – NA
$NA – NA
$NA – NA
$NA – NA
$NA – NA
$NA – NA
$NA – NA
$NA – NA
No data
Thanks for reading our property analysis! We value your feedback. Please take a moment to complete our survey.