Postcode: 2446, NSW - Sale Price Report
Posted on November 15, 2023 • 7 minutes • 1453 words
Property analysis sections
Welcome
Welcome to the Property Panther 2446 postcode sale price report! We value your feedback. Please take a moment to complete our survey and help us improve our property analysis.
Who is this useful for?
Home Buyers:
Understand property affordability in your preferred suburb. Get a detailed breakdown of property types and prices, market dynamics including time on market and transaction volume.
Investors:
Use our report to determine the right time to invest. Gain a comprehensive view of property demand, transaction volume, and current market situation to guide your strategies.
Sellers:
Get insights on potential selling time based on market trends. Understand market pace from ‘Time On Market’ and ‘Transaction Volume’, and learn to price your property competitively from ‘Property Price’.
Location Overview
Welcome to postcode 2446 in New South Wales! This diverse area, encompassing suburbs such as Redbank, Wauchope, and Beechwood, offers a range of housing options and a relaxed lifestyle, with a mix of rural properties, charming townhouses, and picturesque surroundings.


Last Month Property Summary
Based on the given data, the 2446 area in NSW is experiencing a buyer’s market as the median days on market and median sold price have increased while the number of new sold listings has remained relatively stable.
Property Type Breakdown
In postcode 2446 of NSW, Australia, the property stock offers a diverse range of options, with the highest percentage of listings being vacant land followed closely by houses, making it an appealing area for both home builders and those looking for a ready-made home.
Property Demand - Time On Market
Looking at the number of days it takes to sell a property is a good indicator of the amount of demand in a market because it shows how quickly properties are being purchased, reflecting interest and competition among buyers.
Time On Market - Overall
This chart shows how many properties were sold in postcode 2446 during the month of September. Each bar in the chart represents a range of days that properties were up for sale before they were sold. Properties that were on the market for more than 200 days are not included.
The average monthly change in the Days on Market for properties in postcode 2446 during the period shown below was 2 days.
This chart shows the trend of Days on Market over time. Each point on the line represents the average number of days a property was on the market before being sold in a particular month.
Time On Market - By Property Type
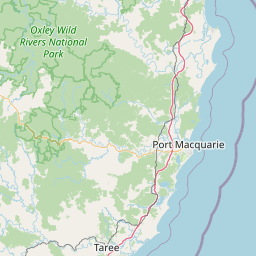
Time On Market - By Suburb
31 – 38
38 – 39
39 – 40
40 – 48
48 – 57
57 – 94
94 – 131
131 – 153
153 – 176
No data
Property Transaction Volume
Transaction Volume - Overall
Transaction Volume - By Property Type
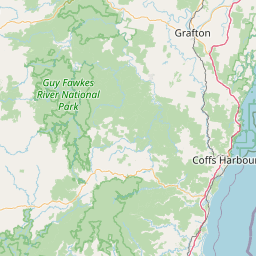
Transaction Volume - By Suburb
0 – 0
0 – 0
0 – 0
0 – 0
0 – 0
0 – 0
0 – 1
1 – 2
2 – 2
Property Price
Price - Overall
This chart shows the distribution of property sale prices in postcode 2446 during the month of September. Each bar in the chart represents a range of prices for properties sold.
The average monthly change in the median sold price of properties in postcode 2446 during the period shown below was $-8174. The trend shows a decrease in the median sold price over time.
Price - By Property Type
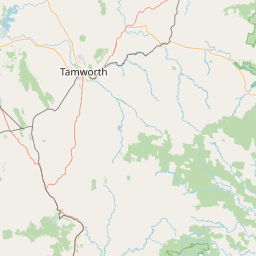
Price - By Suburb
$578,750 – 626,250
$626,250 – 650,000
$650,000 – 650,000
$650,000 – 650,000
$650,000 – 766,000
$766,000 – 882,000
$882,000 – 989,000
$989,000 – 1,087,000
$1,087,000 – 1,185,000
No data
Thanks for reading our property analysis! We value your feedback. Please take a moment to complete our survey.