
Postcode: 2481, NSW - Sale Price Report
Posted on November 15, 2023 • 5 minutes • 977 words
Property analysis sections
Welcome
Welcome to the Property Panther 2481 postcode sale price report! We value your feedback. Please take a moment to complete our survey and help us improve our property analysis.
Who is this useful for?
Home Buyers:
Understand property affordability in your preferred suburb. Get a detailed breakdown of property types and prices, market dynamics including time on market and transaction volume.
Investors:
Use our report to determine the right time to invest. Gain a comprehensive view of property demand, transaction volume, and current market situation to guide your strategies.
Sellers:
Get insights on potential selling time based on market trends. Understand market pace from ‘Time On Market’ and ‘Transaction Volume’, and learn to price your property competitively from ‘Property Price’.
Location Overview
Welcome to the vibrant postcode 2481 in NSW, where diverse suburbs like Suffolk Park, Belongil, and Byron Bay offer a unique coastal lifestyle with a mix of housing options, from beachside properties to rural retreats, catering to the diverse needs and preferences of property buyers. Experience the laid-back atmosphere, stunning beaches, and a tight-knit community that make this postcode a desirable destination for those seeking a relaxed and enriching lifestyle.


Last Month Property Summary
In 2481, NSW, there is a shift towards a more seller’s market as the median sold price increases and the median days on market slightly increase, while the number of new sold listings also increases.
Property Type Breakdown
The property stock in postcode 2481 in NSW Australia is predominantly comprised of houses, making up 66% of the sale listings, followed by apartments, vacant land, townhouses, other types of properties, and acreage or semi-rural properties, respectively, creating a diverse range of options for potential buyers.
Property Demand - Time On Market
Looking at the number of days it takes to sell a property is a good indicator of the amount of demand in a market because it shows how quickly properties are being purchased, reflecting interest and competition among buyers.
Time On Market - Overall
This chart shows how many properties were sold in postcode 2481 during the month of September. Each bar in the chart represents a range of days that properties were up for sale before they were sold. Properties that were on the market for more than 200 days are not included.
The average monthly change in the Days on Market for properties in postcode 2481 during the period shown below was 4 days.
This chart shows the trend of Days on Market over time. Each point on the line represents the average number of days a property was on the market before being sold in a particular month.
Time On Market - By Property Type
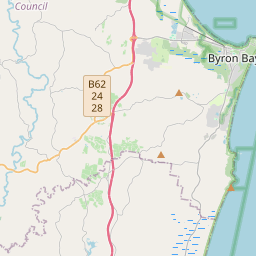
Time On Market - By Suburb
123 – 127
127 – 132
132 – 136
136 – 140
140 – 156
156 – 171
171 – 187
187 – 203
203 – 218
No data
Property Transaction Volume
Transaction Volume - Overall
Transaction Volume - By Property Type
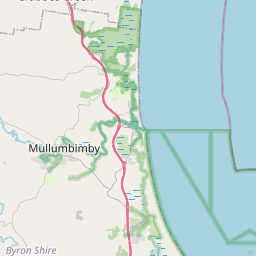
Transaction Volume - By Suburb
0 – 0
0 – 0
0 – 1
1 – 1
1 – 2
2 – 2
2 – 3
3 – 4
4 – 4
Property Price
Price - Overall
This chart shows the distribution of property sale prices in postcode 2481 during the month of September. Each bar in the chart represents a range of prices for properties sold.
The average monthly change in the median sold price of properties in postcode 2481 during the period shown below was $-10022. The trend shows a decrease in the median sold price over time.
Price - By Property Type
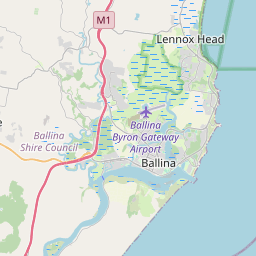
Price - By Suburb
$1,231,650 – 1,494,800
$1,494,800 – 1,757,950
$1,757,950 – 2,021,100
$2,021,100 – 2,284,250
$2,284,250 – 2,547,400
$2,547,400 – 2,810,550
$2,810,550 – 3,073,700
$3,073,700 – 3,336,850
$3,336,850 – 3,600,000
No data
Thanks for reading our property analysis! We value your feedback. Please take a moment to complete our survey.