
Postcode: 2540, NSW - Sale Price Report
Posted on November 15, 2023 • 11 minutes • 2139 words
Property analysis sections
Welcome
Welcome to the Property Panther 2540 postcode sale price report! We value your feedback. Please take a moment to complete our survey and help us improve our property analysis.
Who is this useful for?
Home Buyers:
Understand property affordability in your preferred suburb. Get a detailed breakdown of property types and prices, market dynamics including time on market and transaction volume.
Investors:
Use our report to determine the right time to invest. Gain a comprehensive view of property demand, transaction volume, and current market situation to guide your strategies.
Sellers:
Get insights on potential selling time based on market trends. Understand market pace from ‘Time On Market’ and ‘Transaction Volume’, and learn to price your property competitively from ‘Property Price’.
Location Overview
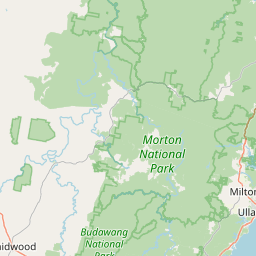
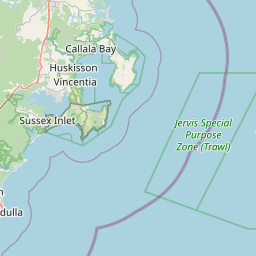
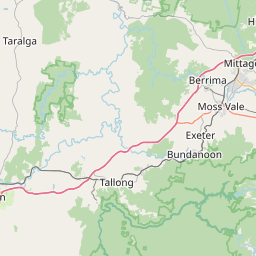
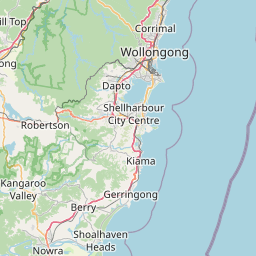
Welcome to the bustling postcode 2540 in NSW, where a diverse range of suburbs like Sanctuary Point, Culburra Beach, and Vincentia attract property buyers seeking a coastal lifestyle. With a variety of housing stock available and a relaxed atmosphere, this area offers a delightful blend of beachside living and charming rural landscapes.


Last Month Property Summary
In 2540, NSW, it appears to be a slight buyer’s market as the median days on market decreased from 94 to 74, the new sold listings decreased from 73 to 63, and the median sold price increased from $765,000 to $830,000.
Property Type Breakdown
In the picturesque postcode 2540 of NSW Australia, housing options are as diverse as the landscapes themselves, with a majority of the properties being houses (56%), followed by new house and land packages (17%), vacant land (12%), and other unique offerings (7%). For those seeking a rural retreat or a taste of apartment living, acreages/semi-rural properties (5%) and apartments/units/flats (3%) also provide idyllic choices.
Property Demand - Time On Market
Looking at the number of days it takes to sell a property is a good indicator of the amount of demand in a market because it shows how quickly properties are being purchased, reflecting interest and competition among buyers.
Time On Market - Overall
This chart shows how many properties were sold in postcode 2540 during the month of September. Each bar in the chart represents a range of days that properties were up for sale before they were sold. Properties that were on the market for more than 200 days are not included.
The average monthly change in the Days on Market for properties in postcode 2540 during the period shown below was 2 days.
This chart shows the trend of Days on Market over time. Each point on the line represents the average number of days a property was on the market before being sold in a particular month.
Time On Market - By Property Type
Time On Market - By Suburb
40 – 64
64 – 80
80 – 82
82 – 85
85 – 103
103 – 122
122 – 162
162 – 230
230 – 315
No data
Property Transaction Volume
Transaction Volume - Overall
Transaction Volume - By Property Type
Transaction Volume - By Suburb
0 – 0
0 – 0
0 – 0
0 – 0
0 – 0
0 – 0
0 – 0
0 – 1
1 – 2
Property Price
Price - Overall
This chart shows the distribution of property sale prices in postcode 2540 during the month of September. Each bar in the chart represents a range of prices for properties sold.
The average monthly change in the median sold price of properties in postcode 2540 during the period shown below was $-4565. The trend shows a decrease in the median sold price over time.
Price - By Property Type
Price - By Suburb
$636,800 – 737,800
$737,800 – 827,200
$827,200 – 874,200
$874,200 – 900,000
$900,000 – 925,500
$925,500 – 971,000
$971,000 – 1,056,500
$1,056,500 – 1,159,000
$1,159,000 – 1,270,000
No data
Thanks for reading our property analysis! We value your feedback. Please take a moment to complete our survey.