
Postcode: 2659, NSW - Sale Price Report
Posted on November 15, 2023 • 4 minutes • 769 words
Property analysis sections
Welcome
Welcome to the Property Panther 2659 postcode sale price report! We value your feedback. Please take a moment to complete our survey and help us improve our property analysis.
Who is this useful for?
Home Buyers:
Understand property affordability in your preferred suburb. Get a detailed breakdown of property types and prices, market dynamics including time on market and transaction volume.
Investors:
Use our report to determine the right time to invest. Gain a comprehensive view of property demand, transaction volume, and current market situation to guide your strategies.
Sellers:
Get insights on potential selling time based on market trends. Understand market pace from ‘Time On Market’ and ‘Transaction Volume’, and learn to price your property competitively from ‘Property Price’.
Location Overview
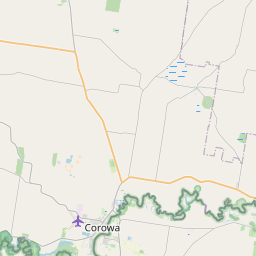
Located in the picturesque countryside of NSW, postcode 2659 encompasses the charming suburbs of Walla Walla and Alma Park. Renowned for its peaceful and close-knit community, this area offers a range of housing options including spacious family homes and rural properties, perfect for those seeking a relaxed and idyllic lifestyle.


Last Month Property Summary
Based on the available data, it is difficult to determine whether the current market in 2659, NSW favors buyers or sellers due to the lack of information on median days on market and median sold price.
Property Type Breakdown
In the picturesque postcode 2659 of NSW, Australia, rural properties take the spotlight, making up 60% of the sale listings, while charming houses account for the remaining 40%, offering a diverse range of options for potential buyers seeking tranquility or a cozy place to call home.
Property Demand - Time On Market
Looking at the number of days it takes to sell a property is a good indicator of the amount of demand in a market because it shows how quickly properties are being purchased, reflecting interest and competition among buyers.
Time On Market - Overall
The average monthly change in the Days on Market for properties in postcode 2659 during the period shown below was 9 days.
This chart shows the trend of Days on Market over time. Each point on the line represents the average number of days a property was on the market before being sold in a particular month.
Time On Market - By Property Type
Time On Market - By Suburb
NA – NA
NA – NA
NA – NA
NA – NA
NA – NA
NA – NA
NA – NA
NA – NA
NA – NA
No data
Property Transaction Volume
Transaction Volume - Overall
Transaction Volume - By Property Type
Transaction Volume - By Suburb
0 – 0
0 – 0
0 – 0
0 – 0
0 – 0
0 – 0
0 – 0
0 – 0
0 – 0
Property Price
Price - Overall
The average monthly change in the median sold price of properties in postcode 2659 during the period shown below was $292687. The trend shows an increase in the median sold price over time.
Price - By Property Type
Price - By Suburb
$NA – NA
$NA – NA
$NA – NA
$NA – NA
$NA – NA
$NA – NA
$NA – NA
$NA – NA
$NA – NA
No data
Thanks for reading our property analysis! We value your feedback. Please take a moment to complete our survey.