
Postcode: 2710, NSW - Sale Price Report
Posted on November 15, 2023 • 5 minutes • 986 words
Property analysis sections
Welcome
Welcome to the Property Panther 2710 postcode sale price report! We value your feedback. Please take a moment to complete our survey and help us improve our property analysis.
Who is this useful for?
Home Buyers:
Understand property affordability in your preferred suburb. Get a detailed breakdown of property types and prices, market dynamics including time on market and transaction volume.
Investors:
Use our report to determine the right time to invest. Gain a comprehensive view of property demand, transaction volume, and current market situation to guide your strategies.
Sellers:
Get insights on potential selling time based on market trends. Understand market pace from ‘Time On Market’ and ‘Transaction Volume’, and learn to price your property competitively from ‘Property Price’.
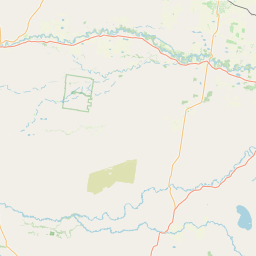
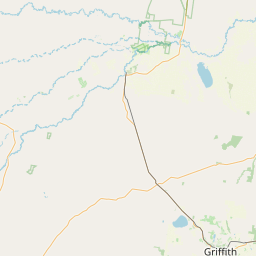
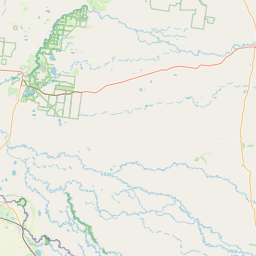
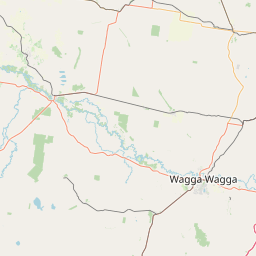
Location Overview
Welcome to the vibrant postcode 2710 in NSW, home to diverse suburbs such as Deniliquin, Calimo, and Mathoura. This region offers a range of housing options, from charming country cottages to modern family homes, reflecting a relaxed and close-knit lifestyle surrounded by picturesque landscapes and a strong sense of community.


Last Month Property Summary
In 2710 NSW, there has been an increase in new sale listings, a decrease in median days on market, an increase in new sold listings, and an increase in the median sold price, indicating a shift towards a more favorable sellers’ market.
Property Type Breakdown
Welcome to the property stock overview for postcode 2710 in NSW, Australia; this vibrant area boasts a diverse range of listings with houses dominating the market representing 46%, while rural properties and vacant land account for 16% and 15% respectively, offering potential homebuyers and investors a wide array of choices to suit their needs.
Property Demand - Time On Market
Looking at the number of days it takes to sell a property is a good indicator of the amount of demand in a market because it shows how quickly properties are being purchased, reflecting interest and competition among buyers.
Time On Market - Overall
This chart shows how many properties were sold in postcode 2710 during the month of September. Each bar in the chart represents a range of days that properties were up for sale before they were sold. Properties that were on the market for more than 200 days are not included.
The average monthly change in the Days on Market for properties in postcode 2710 during the period shown below was 0 days.
This chart shows the trend of Days on Market over time. Each point on the line represents the average number of days a property was on the market before being sold in a particular month.
Time On Market - By Property Type
Time On Market - By Suburb
NA – NA
NA – NA
NA – NA
NA – NA
NA – NA
NA – NA
NA – NA
NA – NA
NA – NA
No data
Property Transaction Volume
Transaction Volume - Overall
Transaction Volume - By Property Type
Transaction Volume - By Suburb
0 – 0
0 – 0
0 – 0
0 – 0
0 – 0
0 – 0
0 – 0
0 – 0
0 – 0
Property Price
Price - Overall
This chart shows the distribution of property sale prices in postcode 2710 during the month of September. Each bar in the chart represents a range of prices for properties sold.
The average monthly change in the median sold price of properties in postcode 2710 during the period shown below was $5435. The trend shows an increase in the median sold price over time.
Price - By Property Type
Price - By Suburb
$NA – NA
$NA – NA
$NA – NA
$NA – NA
$NA – NA
$NA – NA
$NA – NA
$NA – NA
$NA – NA
No data
Thanks for reading our property analysis! We value your feedback. Please take a moment to complete our survey.