Postcode: 2758, NSW - Sale Price Report
Posted on November 15, 2023 • 5 minutes • 964 words
Property analysis sections
Welcome
Welcome to the Property Panther 2758 postcode sale price report! We value your feedback. Please take a moment to complete our survey and help us improve our property analysis.
Who is this useful for?
Home Buyers:
Understand property affordability in your preferred suburb. Get a detailed breakdown of property types and prices, market dynamics including time on market and transaction volume.
Investors:
Use our report to determine the right time to invest. Gain a comprehensive view of property demand, transaction volume, and current market situation to guide your strategies.
Sellers:
Get insights on potential selling time based on market trends. Understand market pace from ‘Time On Market’ and ‘Transaction Volume’, and learn to price your property competitively from ‘Property Price’.
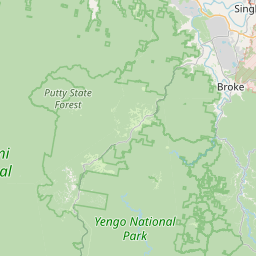
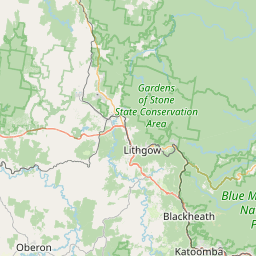
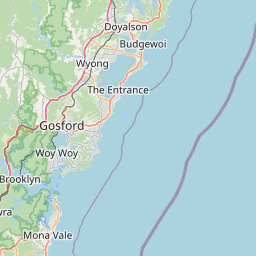
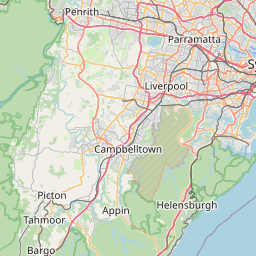
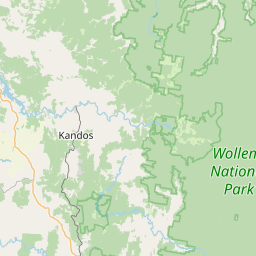
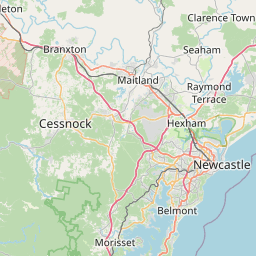
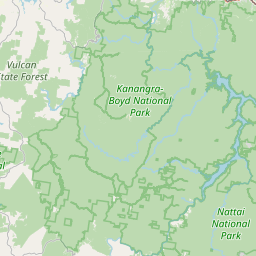
Location Overview
Postcode 2758 is a charming region in NSW that offers a serene country lifestyle, surrounded by picturesque landscapes and national parks. With a diverse range of properties available, including quaint country homes and spacious acreages, buyers can enjoy a peaceful lifestyle while still being within easy reach of urban conveniences.


Last Month Property Summary
Based on the given data, the housing market in 2758, NSW shifted towards a slightly more favorable position for sellers in the current month compared to the prior month, with an increase in median sold price, however, the median days on market also increased.
Property Type Breakdown
Welcome to postcode 2758 in NSW Australia, where the property market offers a diverse selection of options, with houses dominating the listings at 56%, followed closely by acreage/semi-rural properties at 32%, vacant land at 10%, and rural properties at 2%.
Property Demand - Time On Market
Looking at the number of days it takes to sell a property is a good indicator of the amount of demand in a market because it shows how quickly properties are being purchased, reflecting interest and competition among buyers.
Time On Market - Overall
The average monthly change in the Days on Market for properties in postcode 2758 during the period shown below was 4 days.
This chart shows the trend of Days on Market over time. Each point on the line represents the average number of days a property was on the market before being sold in a particular month.
Time On Market - By Property Type
Time On Market - By Suburb
NA – NA
NA – NA
NA – NA
NA – NA
NA – NA
NA – NA
NA – NA
NA – NA
NA – NA
No data
Property Transaction Volume
Transaction Volume - Overall
Transaction Volume - By Property Type
Transaction Volume - By Suburb
0 – 0
0 – 0
0 – 0
0 – 0
0 – 0
0 – 0
0 – 0
0 – 0
0 – 0
Property Price
Price - Overall
The average monthly change in the median sold price of properties in postcode 2758 during the period shown below was $25174. The trend shows an increase in the median sold price over time.
Price - By Property Type
Price - By Suburb
$NA – NA
$NA – NA
$NA – NA
$NA – NA
$NA – NA
$NA – NA
$NA – NA
$NA – NA
$NA – NA
No data
Thanks for reading our property analysis! We value your feedback. Please take a moment to complete our survey.