Newcastle & Region - Hunter, Central & North Coasts - Sale Price Report
Posted on November 15, 2023 • 12 minutes • 2361 words
Property analysis sections
Welcome
Welcome to the Property Panther Newcastle & Region sale price report! We value your feedback. Please take a moment to complete our survey and help us improve our property analysis.
Who is this useful for?
Home Buyers:
Understand property affordability in your preferred suburb. Get a detailed breakdown of property types and prices, market dynamics including time on market and transaction volume.
Investors:
Use our report to determine the right time to invest. Gain a comprehensive view of property demand, transaction volume, and current market situation to guide your strategies.
Sellers:
Get insights on potential selling time based on market trends. Understand market pace from ‘Time On Market’ and ‘Transaction Volume’, and learn to price your property competitively from ‘Property Price’.
Location Overview
Newcastle & Region in NSW offers a vibrant coastal lifestyle with a diverse range of housing options, from charming heritage homes to modern beachside apartments. With its beautiful beaches, thriving arts scene, and delicious food and drink establishments, this area is an ideal destination for property buyers seeking a relaxed yet dynamic place to call home.


Last Month Property Summary
In Newcastle & Region in Hunter, Central & North Coasts, the median days on the market and median sold price remained relatively stable, indicating a balanced market for both buyers and sellers, despite a decrease in new sale listings.
Property Type Breakdown
The Newcastle & Region property market offers a diverse range of options for buyers, with houses being the most popular choice, accounting for 43% of sale listings, followed by apartments/units/flats at 18%, showcasing the city’s balanced mix of urban and suburban living options.
Property Demand - Time On Market
Looking at the number of days it takes to sell a property is a good indicator of the amount of demand in a market because it shows how quickly properties are being purchased, reflecting interest and competition among buyers.
Time On Market - Overall
This chart shows how many properties were sold in Newcastle & Region during the month of September. Each bar in the chart represents a range of days that properties were up for sale before they were sold. Properties that were on the market for more than 200 days are not included.
The average monthly change in the Days on Market for properties in Newcastle & Region during the period shown below was 1 days.
This chart shows the trend of Days on Market over time. Each point on the line represents the average number of days a property was on the market before being sold in a particular month.
Time On Market - By Property Type
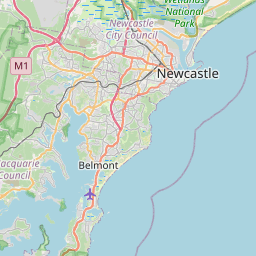
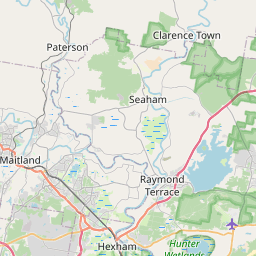
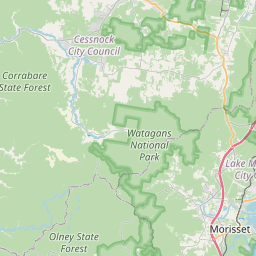
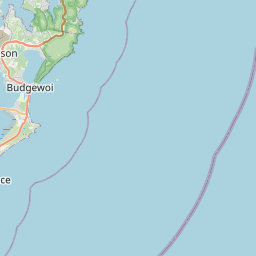
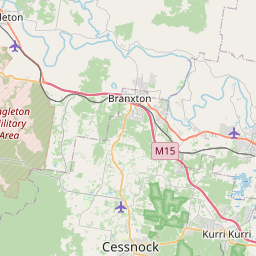
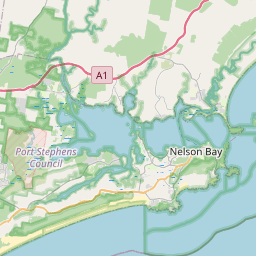
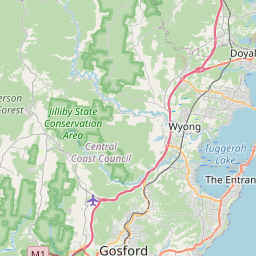
Time On Market - By Suburb
15 – 20
20 – 26
26 – 29
29 – 29
29 – 39
39 – 44
44 – 46
46 – 51
51 – 168
No data
Property Transaction Volume
Transaction Volume - Overall
Transaction Volume - By Property Type
Transaction Volume - By Suburb
0 – 0
0 – 0
0 – 0
0 – 1
1 – 1
1 – 1
1 – 2
2 – 3
3 – 5
Property Price
Price - Overall
This chart shows the distribution of property sale prices in Newcastle & Region during the month of September. Each bar in the chart represents a range of prices for properties sold.
The average monthly change in the median sold price of properties in Newcastle & Region during the period shown below was $-652. The trend shows a decrease in the median sold price over time.
Price - By Property Type
Price - By Suburb
$599,000 – 682,000
$682,000 – 723,550
$723,550 – 791,100
$791,100 – 837,750
$837,750 – 879,200
$879,200 – 1,004,100
$1,004,100 – 1,139,300
$1,139,300 – 1,515,000
$1,515,000 – 2,125,000
No data
Thanks for reading our property analysis! We value your feedback. Please take a moment to complete our survey.