
Shoalhaven - Illawarra & South Coast - Sale Price Report
Posted on November 15, 2023 • 17 minutes • 3518 words
Property analysis sections
Welcome
Welcome to the Property Panther Shoalhaven sale price report! We value your feedback. Please take a moment to complete our survey and help us improve our property analysis.
Who is this useful for?
Home Buyers:
Understand property affordability in your preferred suburb. Get a detailed breakdown of property types and prices, market dynamics including time on market and transaction volume.
Investors:
Use our report to determine the right time to invest. Gain a comprehensive view of property demand, transaction volume, and current market situation to guide your strategies.
Sellers:
Get insights on potential selling time based on market trends. Understand market pace from ‘Time On Market’ and ‘Transaction Volume’, and learn to price your property competitively from ‘Property Price’.
Location Overview
Welcome to Shoalhaven in New South Wales, a charming coastal region that offers a diverse housing stock and a relaxed, beachside lifestyle. With its stunning beaches, picturesque landscapes, and range of properties from coastal retreats to suburban homes, Shoalhaven presents an idyllic destination for property buyers seeking a slice of coastal living.


Last Month Property Summary
In Shoalhaven in Illawarra & South Coast, there is a shift towards a more balanced market with slightly fewer new sale listings, shorter median days on market, and higher median sold prices in the current month compared to the prior month.
Property Type Breakdown
Shoalhaven in NSW, Australia offers a diverse property stock, with houses being the most sought-after, followed by vacant land and new house & land packages, showcasing a variety of options to suit every lifestyle and preference.
Property Demand - Time On Market
Looking at the number of days it takes to sell a property is a good indicator of the amount of demand in a market because it shows how quickly properties are being purchased, reflecting interest and competition among buyers.
Time On Market - Overall
This chart shows how many properties were sold in Shoalhaven during the month of September. Each bar in the chart represents a range of days that properties were up for sale before they were sold. Properties that were on the market for more than 200 days are not included.
The average monthly change in the Days on Market for properties in Shoalhaven during the period shown below was 2 days.
This chart shows the trend of Days on Market over time. Each point on the line represents the average number of days a property was on the market before being sold in a particular month.
Time On Market - By Property Type
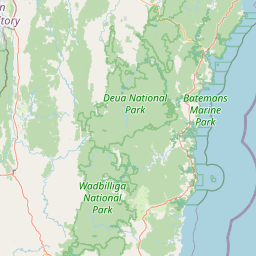
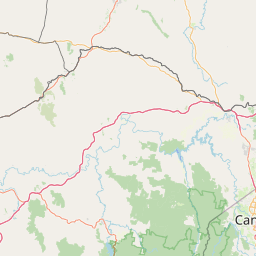
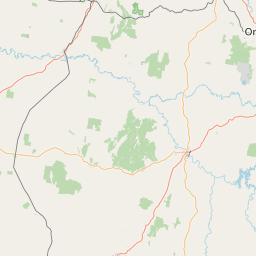
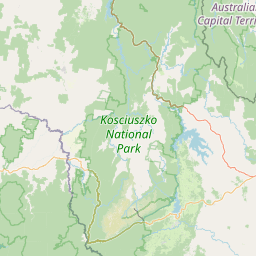
Time On Market - By Suburb
38 – 46
46 – 58
58 – 75
75 – 83
83 – 94
94 – 111
111 – 121
121 – 219
219 – 346
No data
Property Transaction Volume
Transaction Volume - Overall
Transaction Volume - By Property Type
Transaction Volume - By Suburb
0 – 0
0 – 0
0 – 0
0 – 0
0 – 0
0 – 0
0 – 1
1 – 1
1 – 8
Property Price
Price - Overall
This chart shows the distribution of property sale prices in Shoalhaven during the month of September. Each bar in the chart represents a range of prices for properties sold.
The average monthly change in the median sold price of properties in Shoalhaven during the period shown below was $-870. The trend shows a decrease in the median sold price over time.
Price - By Property Type
Price - By Suburb
$616,000 – 691,400
$691,400 – 733,000
$733,000 – 791,000
$791,000 – 797,500
$797,500 – 852,800
$852,800 – 891,400
$891,400 – 912,500
$912,500 – 1,028,000
$1,028,000 – 1,270,000
No data
Thanks for reading our property analysis! We value your feedback. Please take a moment to complete our survey.