Kingscliff - Greater Area - Northern Rivers - Sale Price Report
Posted on November 15, 2023 • 7 minutes • 1479 words
Property analysis sections
Welcome
Welcome to the Property Panther Kingscliff - Greater Area sale price report! We value your feedback. Please take a moment to complete our survey and help us improve our property analysis.
Who is this useful for?
Home Buyers:
Understand property affordability in your preferred suburb. Get a detailed breakdown of property types and prices, market dynamics including time on market and transaction volume.
Investors:
Use our report to determine the right time to invest. Gain a comprehensive view of property demand, transaction volume, and current market situation to guide your strategies.
Sellers:
Get insights on potential selling time based on market trends. Understand market pace from ‘Time On Market’ and ‘Transaction Volume’, and learn to price your property competitively from ‘Property Price’.
Location Overview
Welcome to the Kingscliff - Greater Area, where you’ll find a delightful coastal destination boasting a diverse range of housing options. With its pristine beaches, stunning natural surroundings, and friendly community, this area offers the perfect blend of relaxed coastal living and modern amenities for property buyers seeking a desirable lifestyle.


Last Month Property Summary
In Kingscliff - Greater Area in Northern Rivers, the market appears to have transitioned from a seller’s market to a more balanced market based on the increase in median sold days on market and decrease in new sale listings for the current month compared with the prior month, although the median sold price has also increased.
Property Type Breakdown
Kingscliff - Greater Area in NSW Australia offers a diverse range of property options, with houses accounting for 43% of the sale listings, followed by apartments/units/flats at 25%, and vacant land at 16%.
Property Demand - Time On Market
Looking at the number of days it takes to sell a property is a good indicator of the amount of demand in a market because it shows how quickly properties are being purchased, reflecting interest and competition among buyers.
Time On Market - Overall
This chart shows how many properties were sold in Kingscliff - Greater Area during the month of September. Each bar in the chart represents a range of days that properties were up for sale before they were sold. Properties that were on the market for more than 200 days are not included.
The average monthly change in the Days on Market for properties in Kingscliff - Greater Area during the period shown below was 1 days.
This chart shows the trend of Days on Market over time. Each point on the line represents the average number of days a property was on the market before being sold in a particular month.
Time On Market - By Property Type
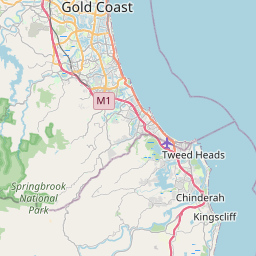
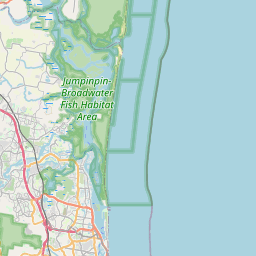
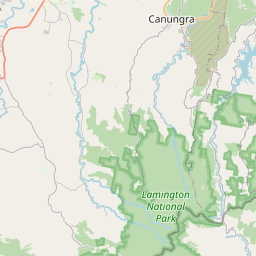
Time On Market - By Suburb
35 – 48
48 – 56
56 – 60
60 – 64
64 – 65
65 – 66
66 – 78
78 – 100
100 – 122
No data
Property Transaction Volume
Transaction Volume - Overall
Transaction Volume - By Property Type
Transaction Volume - By Suburb
0 – 0
0 – 0
0 – 0
0 – 0
0 – 0
0 – 1
1 – 2
2 – 4
4 – 5
Property Price
Price - Overall
This chart shows the distribution of property sale prices in Kingscliff - Greater Area during the month of September. Each bar in the chart represents a range of prices for properties sold.
The average monthly change in the median sold price of properties in Kingscliff - Greater Area during the period shown below was $11241. The trend shows an increase in the median sold price over time.
Price - By Property Type
Price - By Suburb
$731,250 – 927,500
$927,500 – 1,035,000
$1,035,000 – 1,142,500
$1,142,500 – 1,146,250
$1,146,250 – 1,150,000
$1,150,000 – 1,158,750
$1,158,750 – 1,167,500
$1,167,500 – 1,533,750
$1,533,750 – 1,900,000
No data
Thanks for reading our property analysis! We value your feedback. Please take a moment to complete our survey.