Lismore - Greater Area - Northern Rivers - Sale Price Report
Posted on November 15, 2023 • 11 minutes • 2283 words
Property analysis sections
Welcome
Welcome to the Property Panther Lismore - Greater Area sale price report! We value your feedback. Please take a moment to complete our survey and help us improve our property analysis.
Who is this useful for?
Home Buyers:
Understand property affordability in your preferred suburb. Get a detailed breakdown of property types and prices, market dynamics including time on market and transaction volume.
Investors:
Use our report to determine the right time to invest. Gain a comprehensive view of property demand, transaction volume, and current market situation to guide your strategies.
Sellers:
Get insights on potential selling time based on market trends. Understand market pace from ‘Time On Market’ and ‘Transaction Volume’, and learn to price your property competitively from ‘Property Price’.
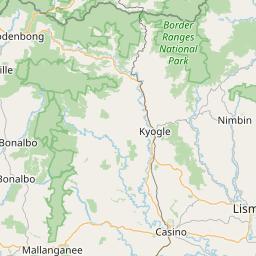
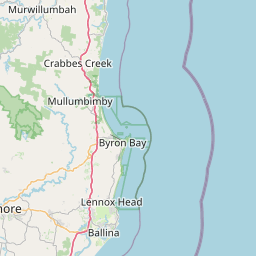
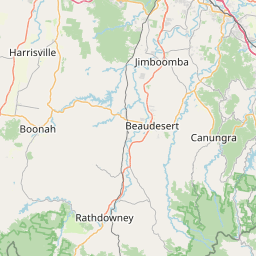
Location Overview
Welcome to Lismore, a vibrant and picturesque area in NSW with a diverse housing stock ranging from charming country cottages to modern family homes, providing plenty of options for property buyers. Embrace a relaxed and laid-back lifestyle surrounded by stunning natural landscapes, lush forests, and friendly communities, making it a desirable location for those seeking a peaceful yet convenient place to call home.


Last Month Property Summary
In Lismore - Greater Area in Northern Rivers, it seems to be more of a sellers market based on the decrease in new sale listings and the increase in median sold price.
Property Type Breakdown
The property stock in the Lismore - Greater Area of NSW Australia offers a diverse range of options, with houses being the most popular choice, followed by vacant land and rural properties; making it an enticing location for both those seeking a rural lifestyle and those looking for residential opportunities.
Property Demand - Time On Market
Looking at the number of days it takes to sell a property is a good indicator of the amount of demand in a market because it shows how quickly properties are being purchased, reflecting interest and competition among buyers.
Time On Market - Overall
This chart shows how many properties were sold in Lismore - Greater Area during the month of September. Each bar in the chart represents a range of days that properties were up for sale before they were sold. Properties that were on the market for more than 200 days are not included.
The average monthly change in the Days on Market for properties in Lismore - Greater Area during the period shown below was 1 days.
This chart shows the trend of Days on Market over time. Each point on the line represents the average number of days a property was on the market before being sold in a particular month.
Time On Market - By Property Type
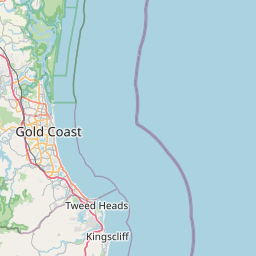
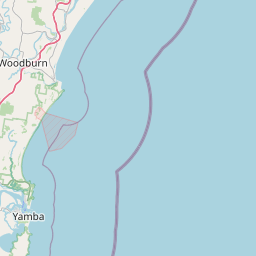
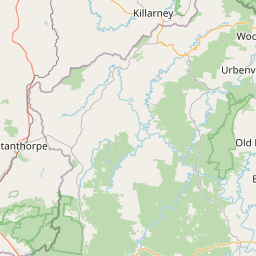
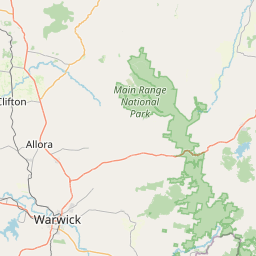
Time On Market - By Suburb
16 – 19
19 – 21
21 – 29
29 – 44
44 – 58
58 – 64
64 – 80
80 – 96
96 – 108
No data
Property Transaction Volume
Transaction Volume - Overall
Transaction Volume - By Property Type
Transaction Volume - By Suburb
0 – 0
0 – 0
0 – 0
0 – 0
0 – 0
0 – 0
0 – 0
0 – 1
1 – 6
Property Price
Price - Overall
This chart shows the distribution of property sale prices in Lismore - Greater Area during the month of September. Each bar in the chart represents a range of prices for properties sold.
The average monthly change in the median sold price of properties in Lismore - Greater Area during the period shown below was $-2848. The trend shows a decrease in the median sold price over time.
Price - By Property Type
Price - By Suburb
$550,800 – 552,600
$552,600 – 554,400
$554,400 – 591,400
$591,400 – 646,000
$646,000 – 700,600
$700,600 – 752,300
$752,300 – 798,200
$798,200 – 844,100
$844,100 – 890,000
No data
Thanks for reading our property analysis! We value your feedback. Please take a moment to complete our survey.