
Hills - Sydney - Sale Price Report
Posted on November 15, 2023 • 9 minutes • 1709 words
Property analysis sections
Welcome
Welcome to the Property Panther Hills sale price report! We value your feedback. Please take a moment to complete our survey and help us improve our property analysis.
Who is this useful for?
Home Buyers:
Understand property affordability in your preferred suburb. Get a detailed breakdown of property types and prices, market dynamics including time on market and transaction volume.
Investors:
Use our report to determine the right time to invest. Gain a comprehensive view of property demand, transaction volume, and current market situation to guide your strategies.
Sellers:
Get insights on potential selling time based on market trends. Understand market pace from ‘Time On Market’ and ‘Transaction Volume’, and learn to price your property competitively from ‘Property Price’.
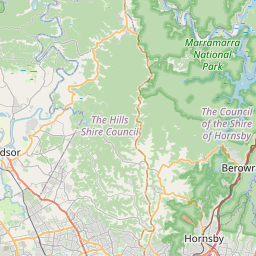
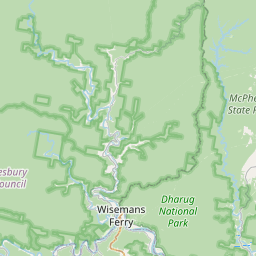
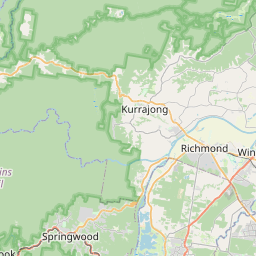
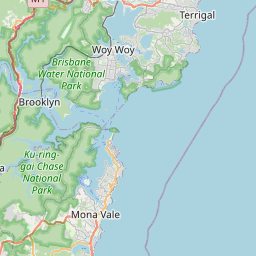
Location Overview
Welcome to the picturesque Hills region in New South Wales, a sought-after area for property buyers looking for a blend of natural beauty and suburban convenience. Here, you’ll discover a diverse housing stock, ranging from family homes with ample outdoor space to modern apartments, all while enjoying a vibrant lifestyle with access to stunning parks, charming wineries, and a thriving arts and culinary scene.
Last Month Property Summary
The housing market in Hills in the Sydney Region shifted towards a seller’s market as the median days on market increased slightly from 33 to 36 days, and the median sold price rose from $1,761,000 to $1,898,000, while the number of new sold listings decreased from 251 to 59.
Property Type Breakdown
In the beautiful Hills region of NSW, Australia, the property stock offers a diverse range of options, with houses accounting for 30% of listings, closely followed by new house and land packages at 25%, ensuring there is something for everyone seeking their dream home.
Property Demand - Time On Market
Looking at the number of days it takes to sell a property is a good indicator of the amount of demand in a market because it shows how quickly properties are being purchased, reflecting interest and competition among buyers.
Time On Market - Overall
This chart shows how many properties were sold in Hills during the month of September. Each bar in the chart represents a range of days that properties were up for sale before they were sold. Properties that were on the market for more than 200 days are not included.
The average monthly change in the Days on Market for properties in Hills during the period shown below was 1 days.
This chart shows the trend of Days on Market over time. Each point on the line represents the average number of days a property was on the market before being sold in a particular month.
Time On Market - By Property Type
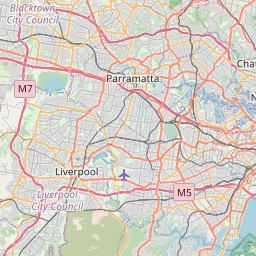
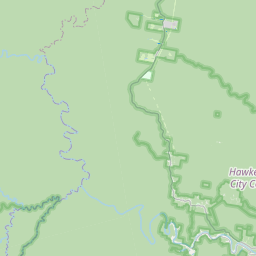
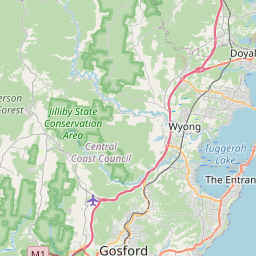
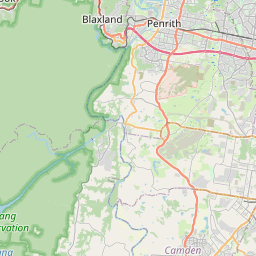
Time On Market - By Suburb
15 – 17
17 – 18
18 – 39
39 – 70
70 – 79
79 – 85
85 – 88
88 – 88
88 – 126
No data
Property Transaction Volume
Transaction Volume - Overall
Transaction Volume - By Property Type
Transaction Volume - By Suburb
0 – 0
0 – 0
0 – 1
1 – 1
1 – 2
2 – 3
3 – 4
4 – 5
5 – 13
Property Price
Price - Overall
This chart shows the distribution of property sale prices in Hills during the month of September. Each bar in the chart represents a range of prices for properties sold.
The average monthly change in the median sold price of properties in Hills during the period shown below was $7739. The trend shows an increase in the median sold price over time.
Price - By Property Type
Price - By Suburb
$1,722,000 – 1,750,000
$1,750,000 – 1,804,000
$1,804,000 – 1,944,000
$1,944,000 – 2,155,500
$2,155,500 – 2,184,000
$2,184,000 – 2,210,000
$2,210,000 – 2,291,000
$2,291,000 – 2,387,000
$2,387,000 – 2,410,000
No data
Thanks for reading our property analysis! We value your feedback. Please take a moment to complete our survey.