Northern Suburbs - Sydney - Sale Price Report
Posted on November 15, 2023 • 10 minutes • 1930 words
Property analysis sections
Welcome
Welcome to the Property Panther Northern Suburbs sale price report! We value your feedback. Please take a moment to complete our survey and help us improve our property analysis.
Who is this useful for?
Home Buyers:
Understand property affordability in your preferred suburb. Get a detailed breakdown of property types and prices, market dynamics including time on market and transaction volume.
Investors:
Use our report to determine the right time to invest. Gain a comprehensive view of property demand, transaction volume, and current market situation to guide your strategies.
Sellers:
Get insights on potential selling time based on market trends. Understand market pace from ‘Time On Market’ and ‘Transaction Volume’, and learn to price your property competitively from ‘Property Price’.
Location Overview
The Northern Suburbs in NSW offer a charming blend of suburban living and urban convenience. With an array of housing options ranging from family homes to spacious apartments, coupled with leafy streets and a strong sense of community, it’s an ideal destination for property buyers seeking a balanced lifestyle.
Last Month Property Summary
In the Northern Suburbs of Sydney, it is currently a sellers’ market with a decrease in new sale listings, a slight improvement in median days on market, and a significant increase in median sold price compared to the prior month.
Property Type Breakdown
In the Northern Suburbs of NSW, Australia, apartments and units dominate the property market, making up an impressive 63% of sale listings, closely followed by houses at 25%, offering a wide range of options for potential buyers looking for their dream home or investment property.
Property Demand - Time On Market
Looking at the number of days it takes to sell a property is a good indicator of the amount of demand in a market because it shows how quickly properties are being purchased, reflecting interest and competition among buyers.
Time On Market - Overall
This chart shows how many properties were sold in Northern Suburbs during the month of September. Each bar in the chart represents a range of days that properties were up for sale before they were sold. Properties that were on the market for more than 200 days are not included.
The average monthly change in the Days on Market for properties in Northern Suburbs during the period shown below was 0 days.
This chart shows the trend of Days on Market over time. Each point on the line represents the average number of days a property was on the market before being sold in a particular month.
Time On Market - By Property Type
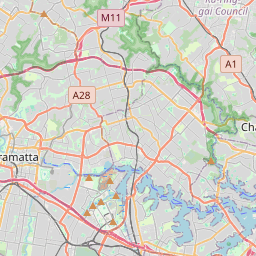
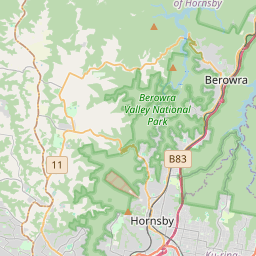
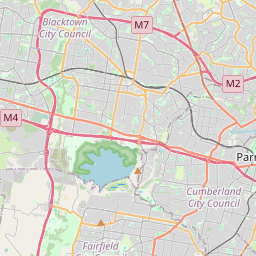
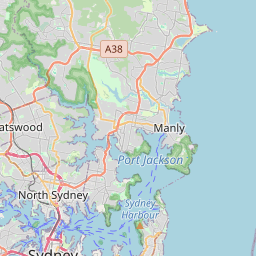
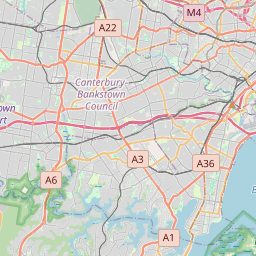
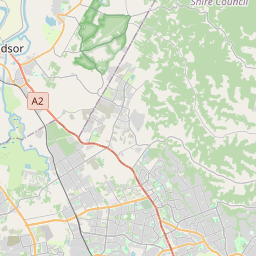
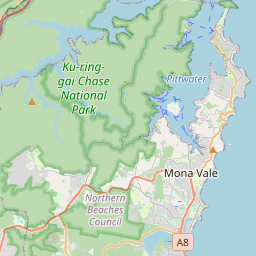
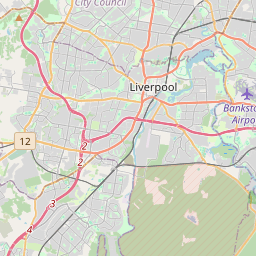
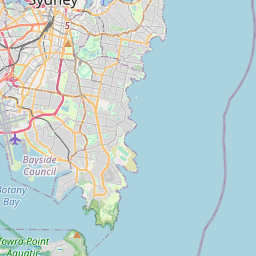
Time On Market - By Suburb
8 – 19
19 – 26
26 – 28
28 – 30
30 – 36
36 – 40
40 – 45
45 – 56
56 – 60
No data
Property Transaction Volume
Transaction Volume - Overall
Transaction Volume - By Property Type
Transaction Volume - By Suburb
1 – 1
1 – 1
1 – 1
1 – 2
2 – 3
3 – 4
4 – 6
6 – 9
9 – 11
Property Price
Price - Overall
This chart shows the distribution of property sale prices in Northern Suburbs during the month of September. Each bar in the chart represents a range of prices for properties sold.
The average monthly change in the median sold price of properties in Northern Suburbs during the period shown below was $4565. The trend shows an increase in the median sold price over time.
Price - By Property Type
Price - By Suburb
$849,000 – 971,000
$971,000 – 1,316,800
$1,316,800 – 2,003,400
$2,003,400 – 2,157,000
$2,157,000 – 2,221,000
$2,221,000 – 2,270,600
$2,270,600 – 2,470,000
$2,470,000 – 3,140,000
$3,140,000 – 8,250,000
No data
Thanks for reading our property analysis! We value your feedback. Please take a moment to complete our survey.